Get Winning Stock in Just Minutes—No More Hours of Research
Cut the noise. Capture the best.

Predefined Scanner with Backtest
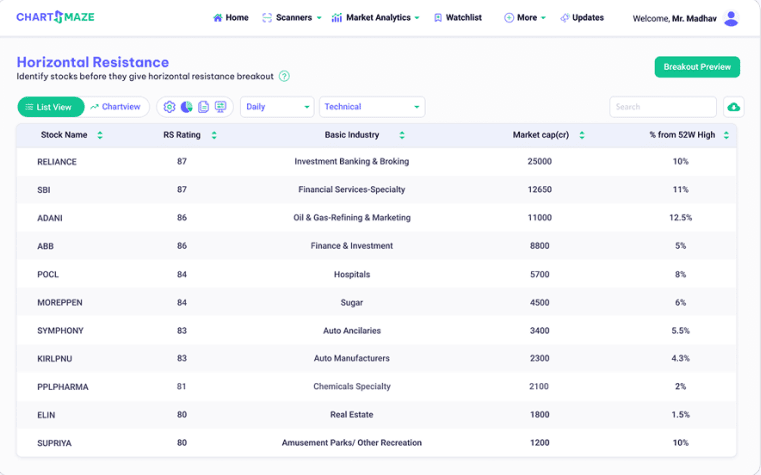
Find top chart patterns in seconds
Custom Scanner
Build your own scans—fast and easy
Market Analytics
Spot market health, find strong sectors
Watchlist
Save, monitor, and revisit setups
Why use ChartsMaze

Advanced Technical Analysis
Access powerful charting tools, Custom Scanners, and automated pattern recognition to identify high-probability setups faster than ever.
- ✅ Multi-timeframe analysis
- ✅ Custom Scanners
- ✅ Pattern recognition
- ✅ Historical backtesting
Popular Scanners
Our technical scanners help you identify high-probability trading setups across Indian markets
Horizontal Resistance
Identify stocks with unfilled gaps for potential reversals
Tight Setup
Find stocks with false breakouts and reversal potential
Positive Earnings Reaction
Detect unusual volume activity indicating strong momentum
RS High Before Price High
Detect unusual volume activity indicating strong momentum
Track.Reflect.Improve.
Your personal trade journal for smarter moves.
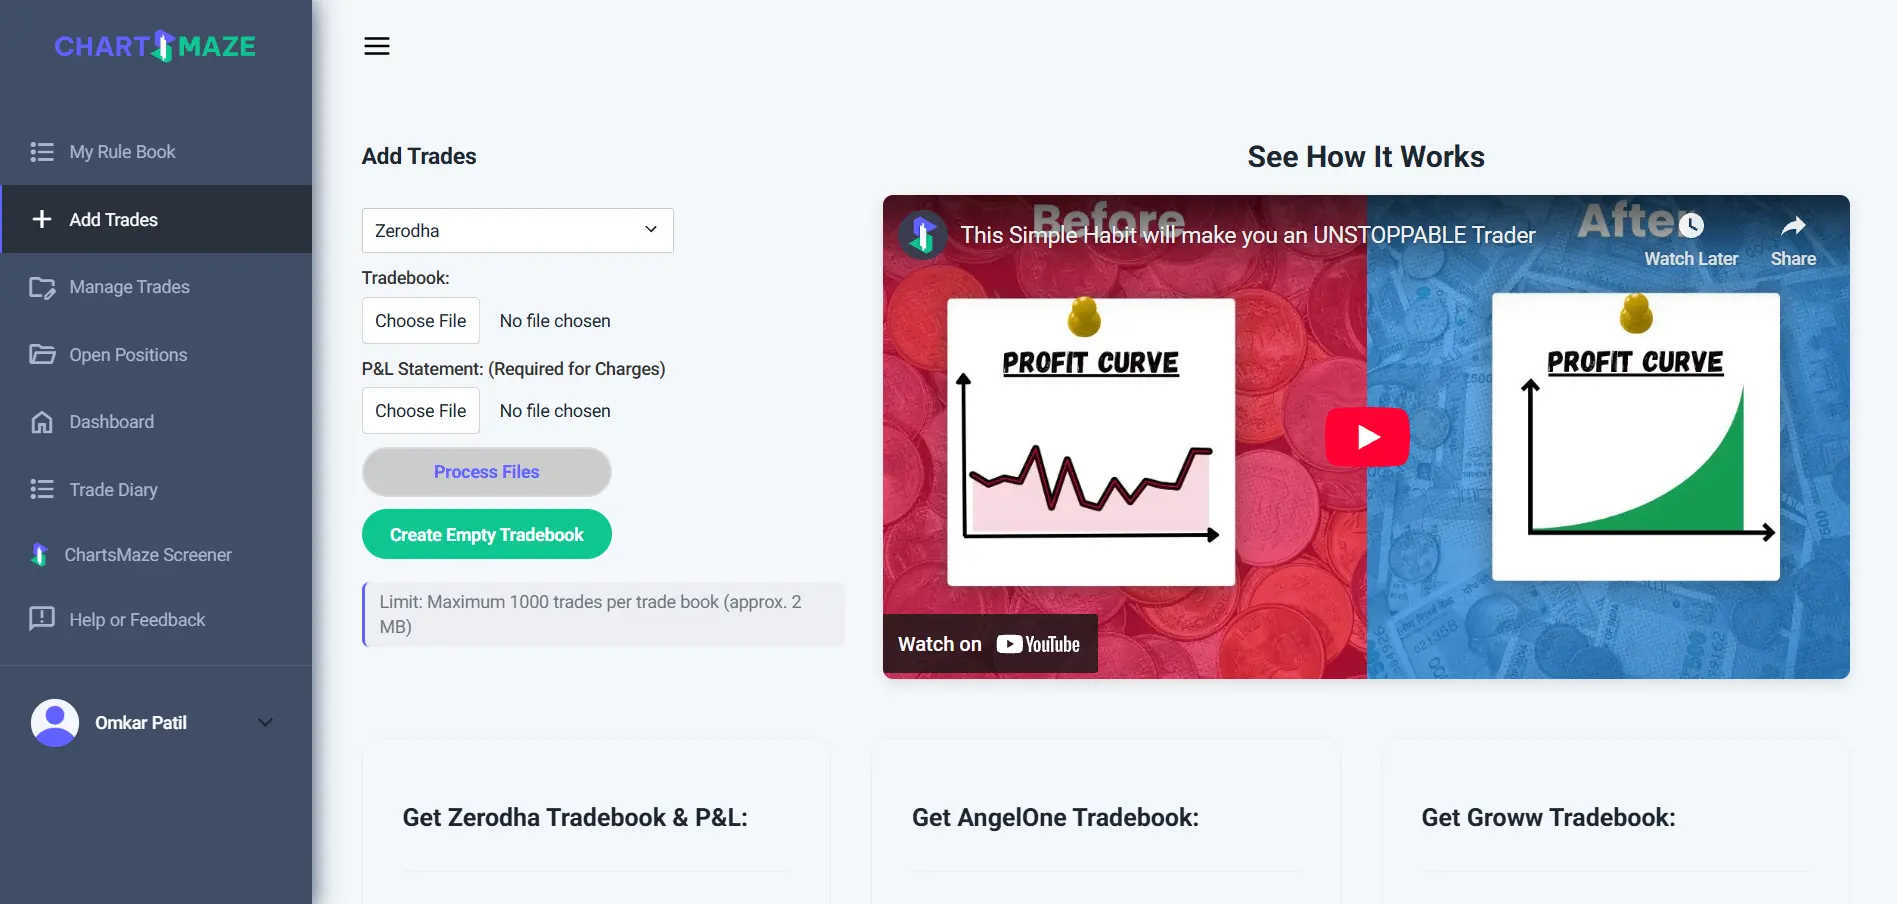
- ✅ Log trades with detailed metrics.
- ✅ Upload charts and notes for each trade.
- ✅ Reflect on mistakes and patterns.
- ✅ Create your own custom scanners.

Frequently Asked Questions
Everything you need to know about ChartsMaze
You can reach out to us at techscannerpro@gmail.com or you can DM us on Twitter.
Monthly - ₹499/-
Semi-Annual - ₹2499/-
Annual - ₹3499/-
What Traders Say
Hear from traders who use ChartsMaze to find better setups and improve their trading results


