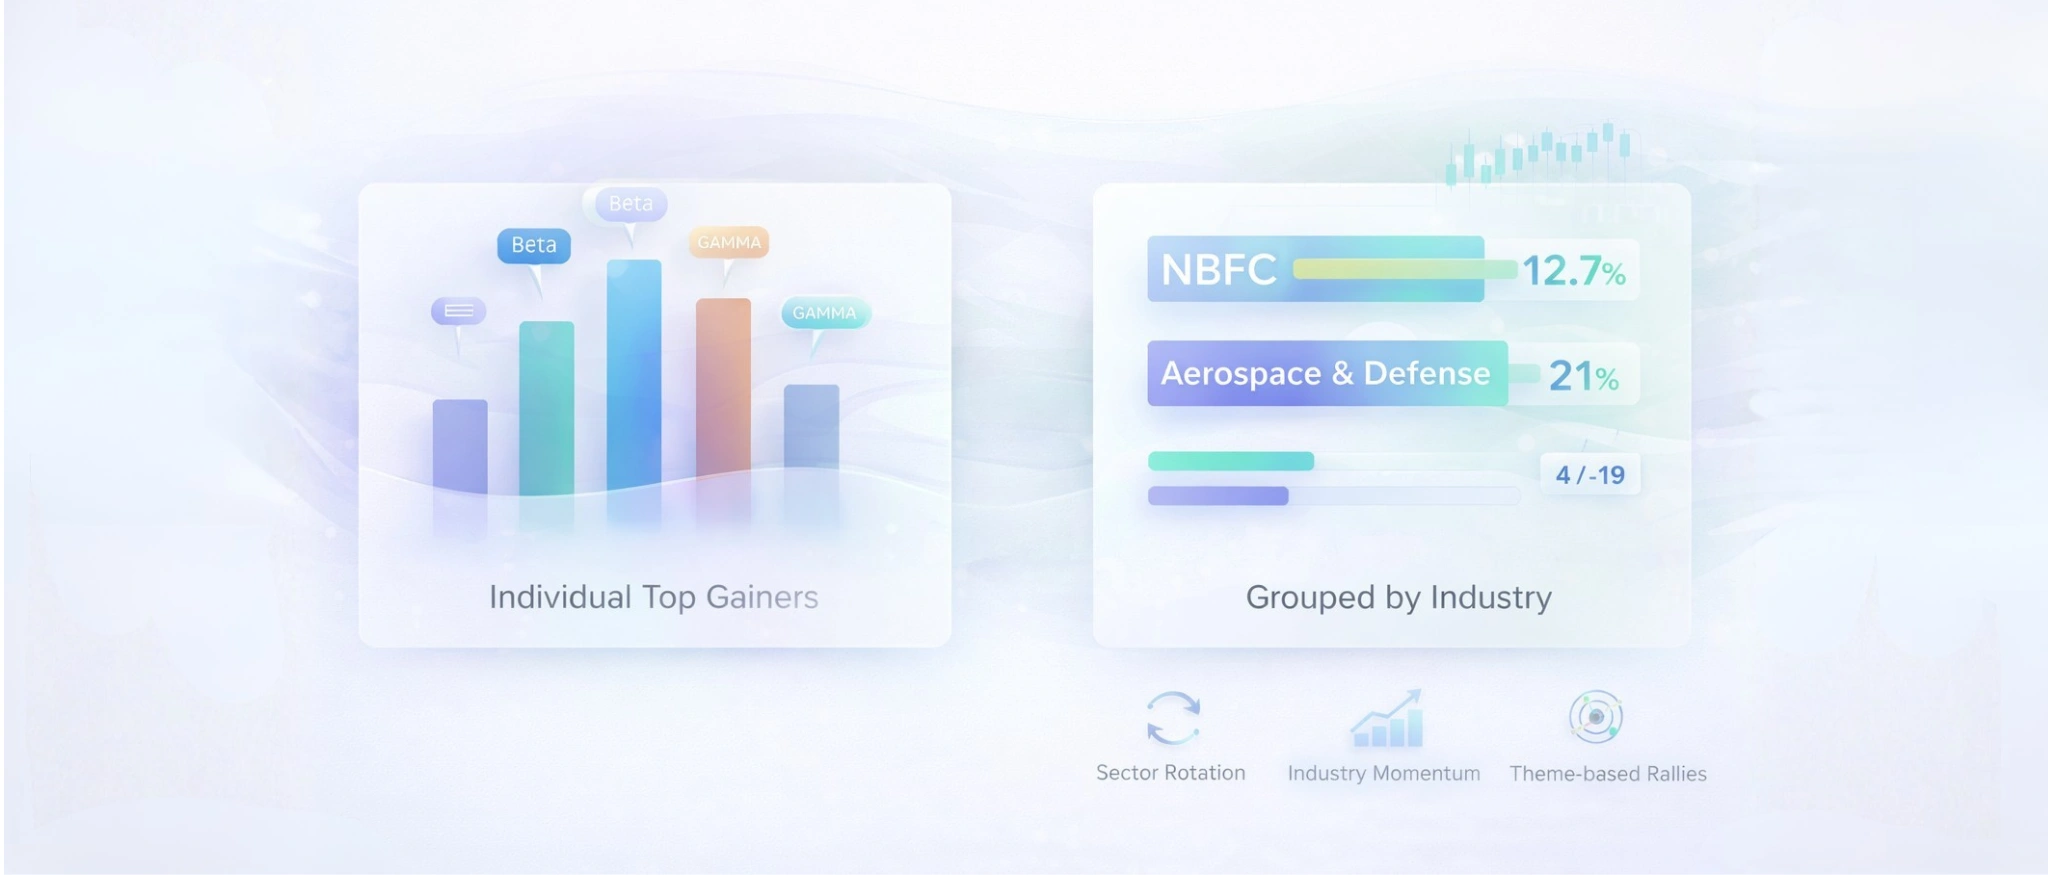
This article explains how to analyze top gainer stocks by grouping them into industry categories, using percentage dominance rather than absolute counts to identify genuine sector rotation and group moves.
When traders think about Top Gainers, they usually think about individual stocks that have risen sharply in a single trading session, often 10%, 15%, or even 20%.
Most traders analyze these stocks individually. But there is a much more powerful way to use the Top Gainers list that many people overlook.
Instead of looking at Top Gainers only at the individual stock level, you can analyze them at the industry level.
By grouping the top gaining stocks by their industry, you can quickly detect:
- Sector rotation
- Industry-wide momentum
- Theme-based rallies
- News-driven industry moves
How to Group Top Gainers by Industry
Classifying top gainer stocks by their industry groups allows traders to identify whether an entire industry is showing momentum.
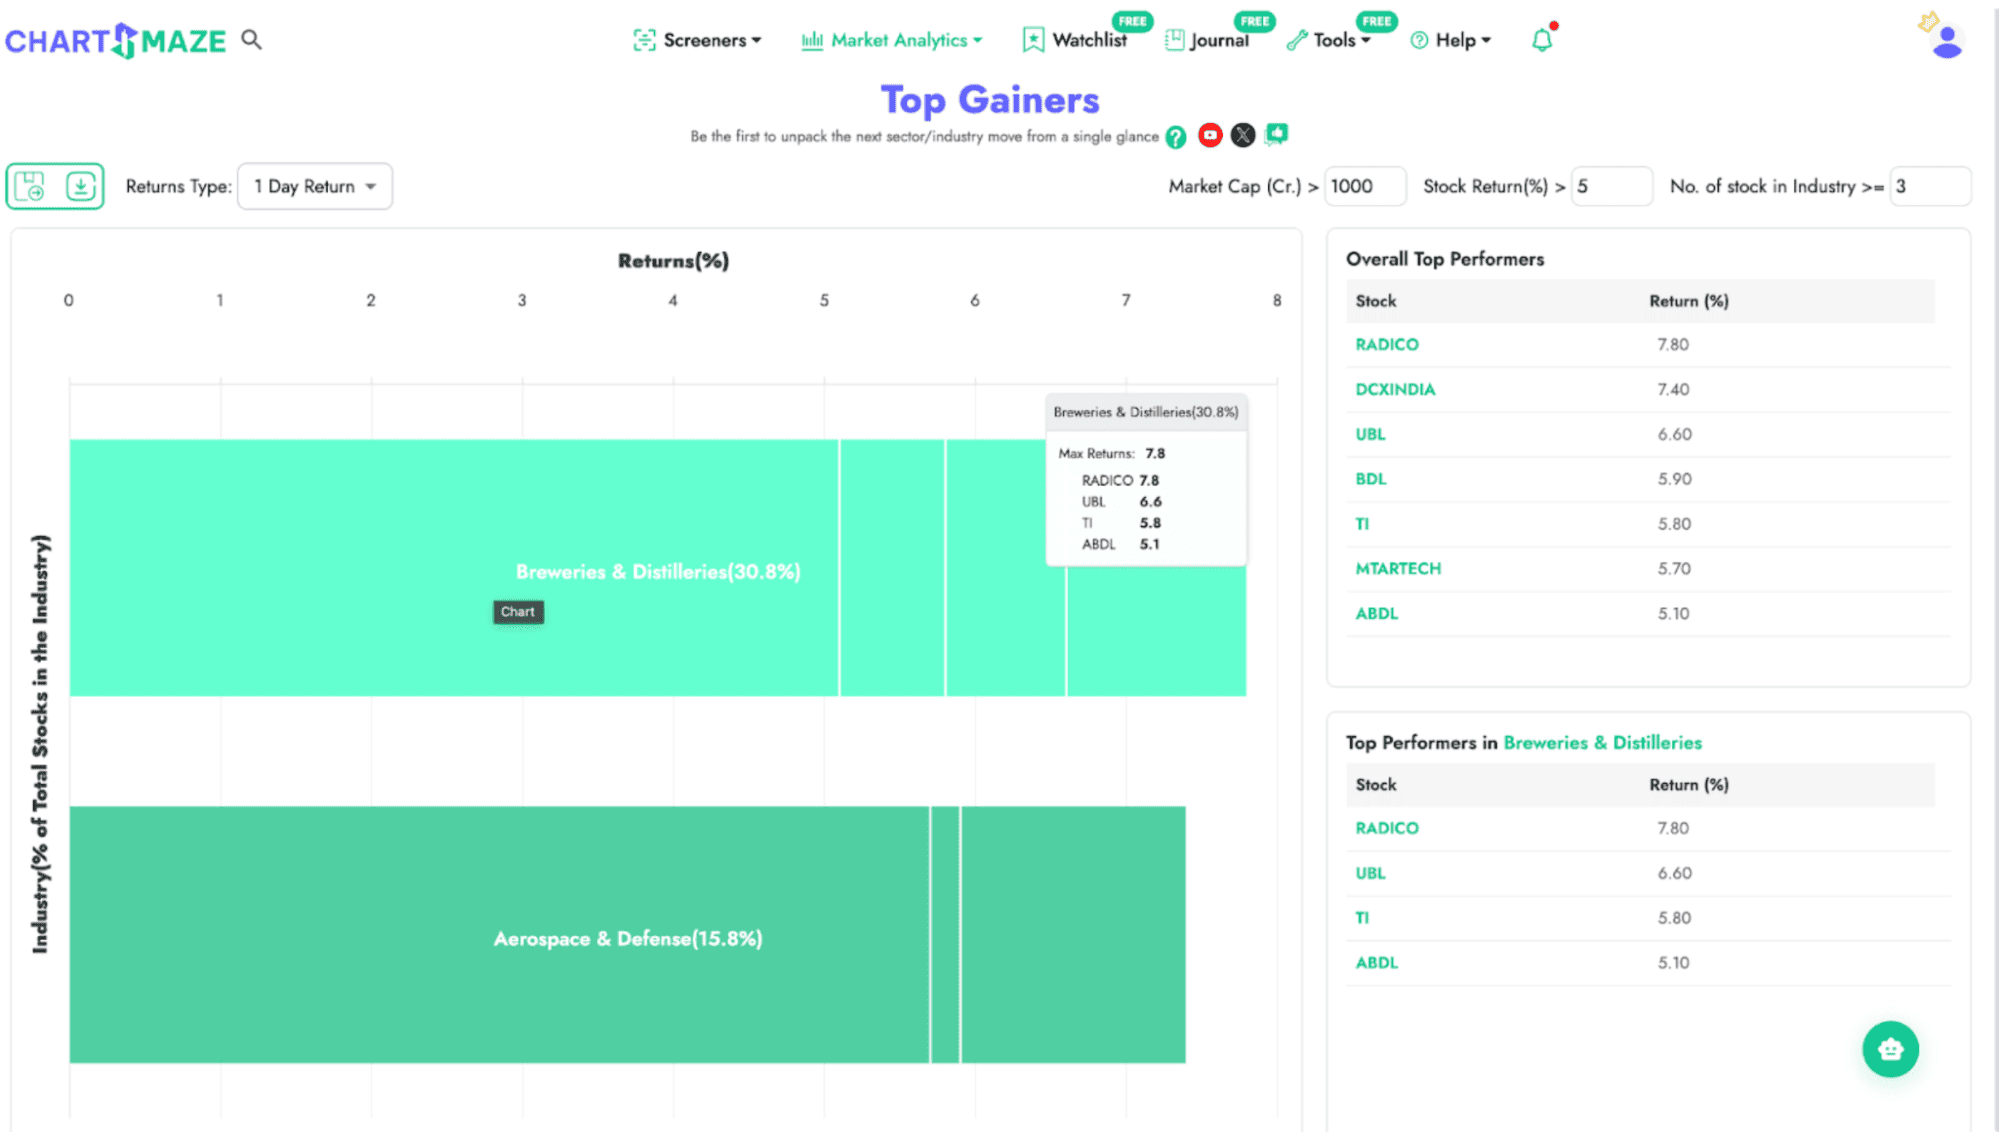
A simple act of grouping stocks into industries will give a second level insight. If there is an industry which happens to have many top gainers, it means the whole industry has shown a group move today.
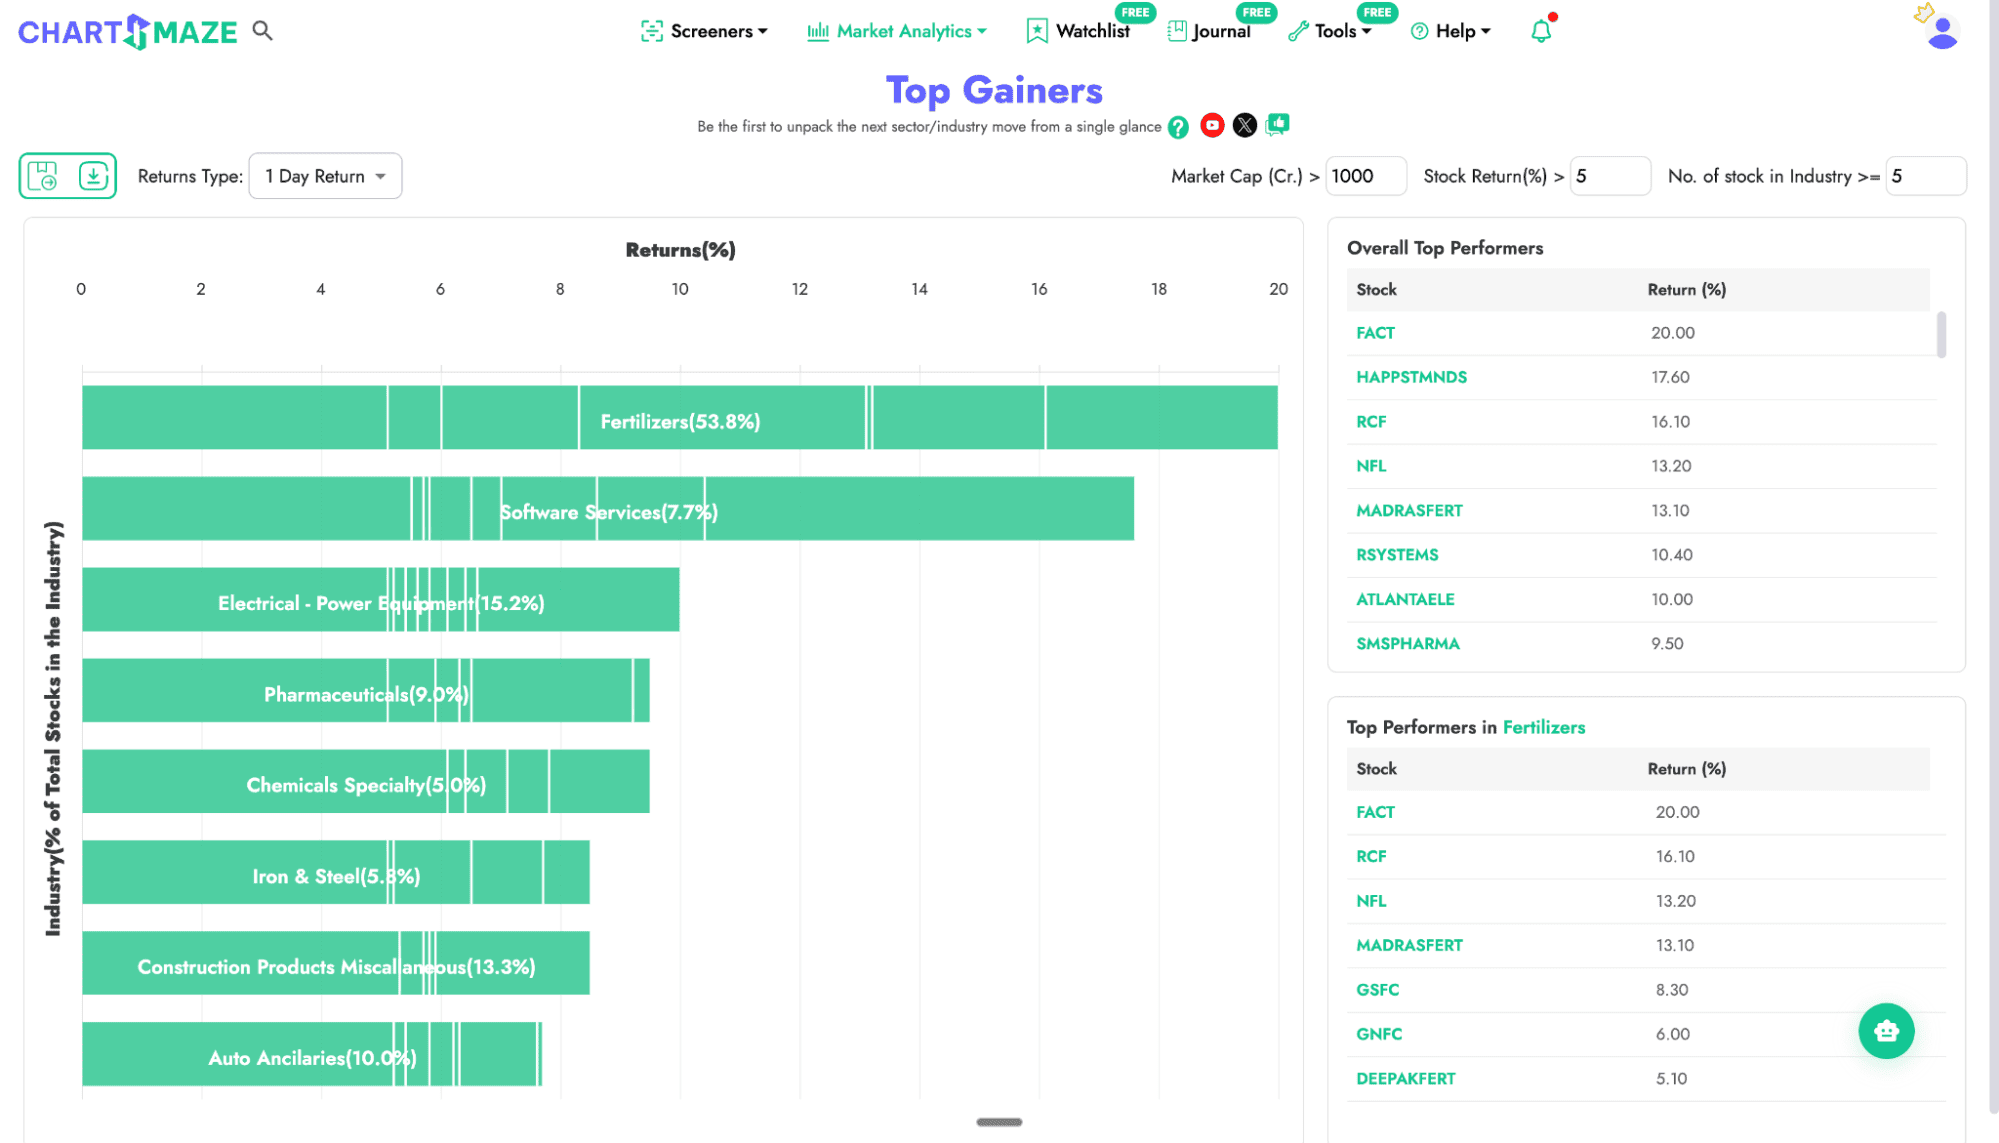
What does the number in the bracket next to industry represent though? Let's understand below.
Why Percentage Matters More Than Absolute Numbers
Absolute numbers could be misleading. Let us explain with an example.
Let's say on today's list of top gainers you find 6 stocks from NBFC, and 4 stocks from Aerospace and Defense industry. You might be quick to conclude that clearly the NBFC industry gave a strong group move.
But these 6 and 4 are absolute numbers, it's not the right way to analyse data. You've to calculate % of stocks from that industry that made it to the top gainers list. The higher the %, the stronger the group moves.
| Industry | Stocks in Industry | Stocks in Top gainers | Percentage |
|---|---|---|---|
| NBFC | 47 | 7 | 12.7% |
| Aerospace & Defense | 19 | 4 | 21% |
Even though NBFC had more stocks in absolute terms, Aerospace & Defense showed stronger industry participation.
So the conclusion is clear, prefer higher% than higher absolute numbers
Is there a specific % cut off? There is no hard and fast rule, but >15% is a good number to watch out for.
How to Spot Sector Rotation on Day 1
The edge in analysing top gainers stocks this way is that you can find the group move on Day 1 itself before it is all over social media.
All it takes is every day you visit our top gainers page, and see if there is a signal of group move and move on to stock scanning.
Using Weekly and Monthly Gainers for Broader Trends
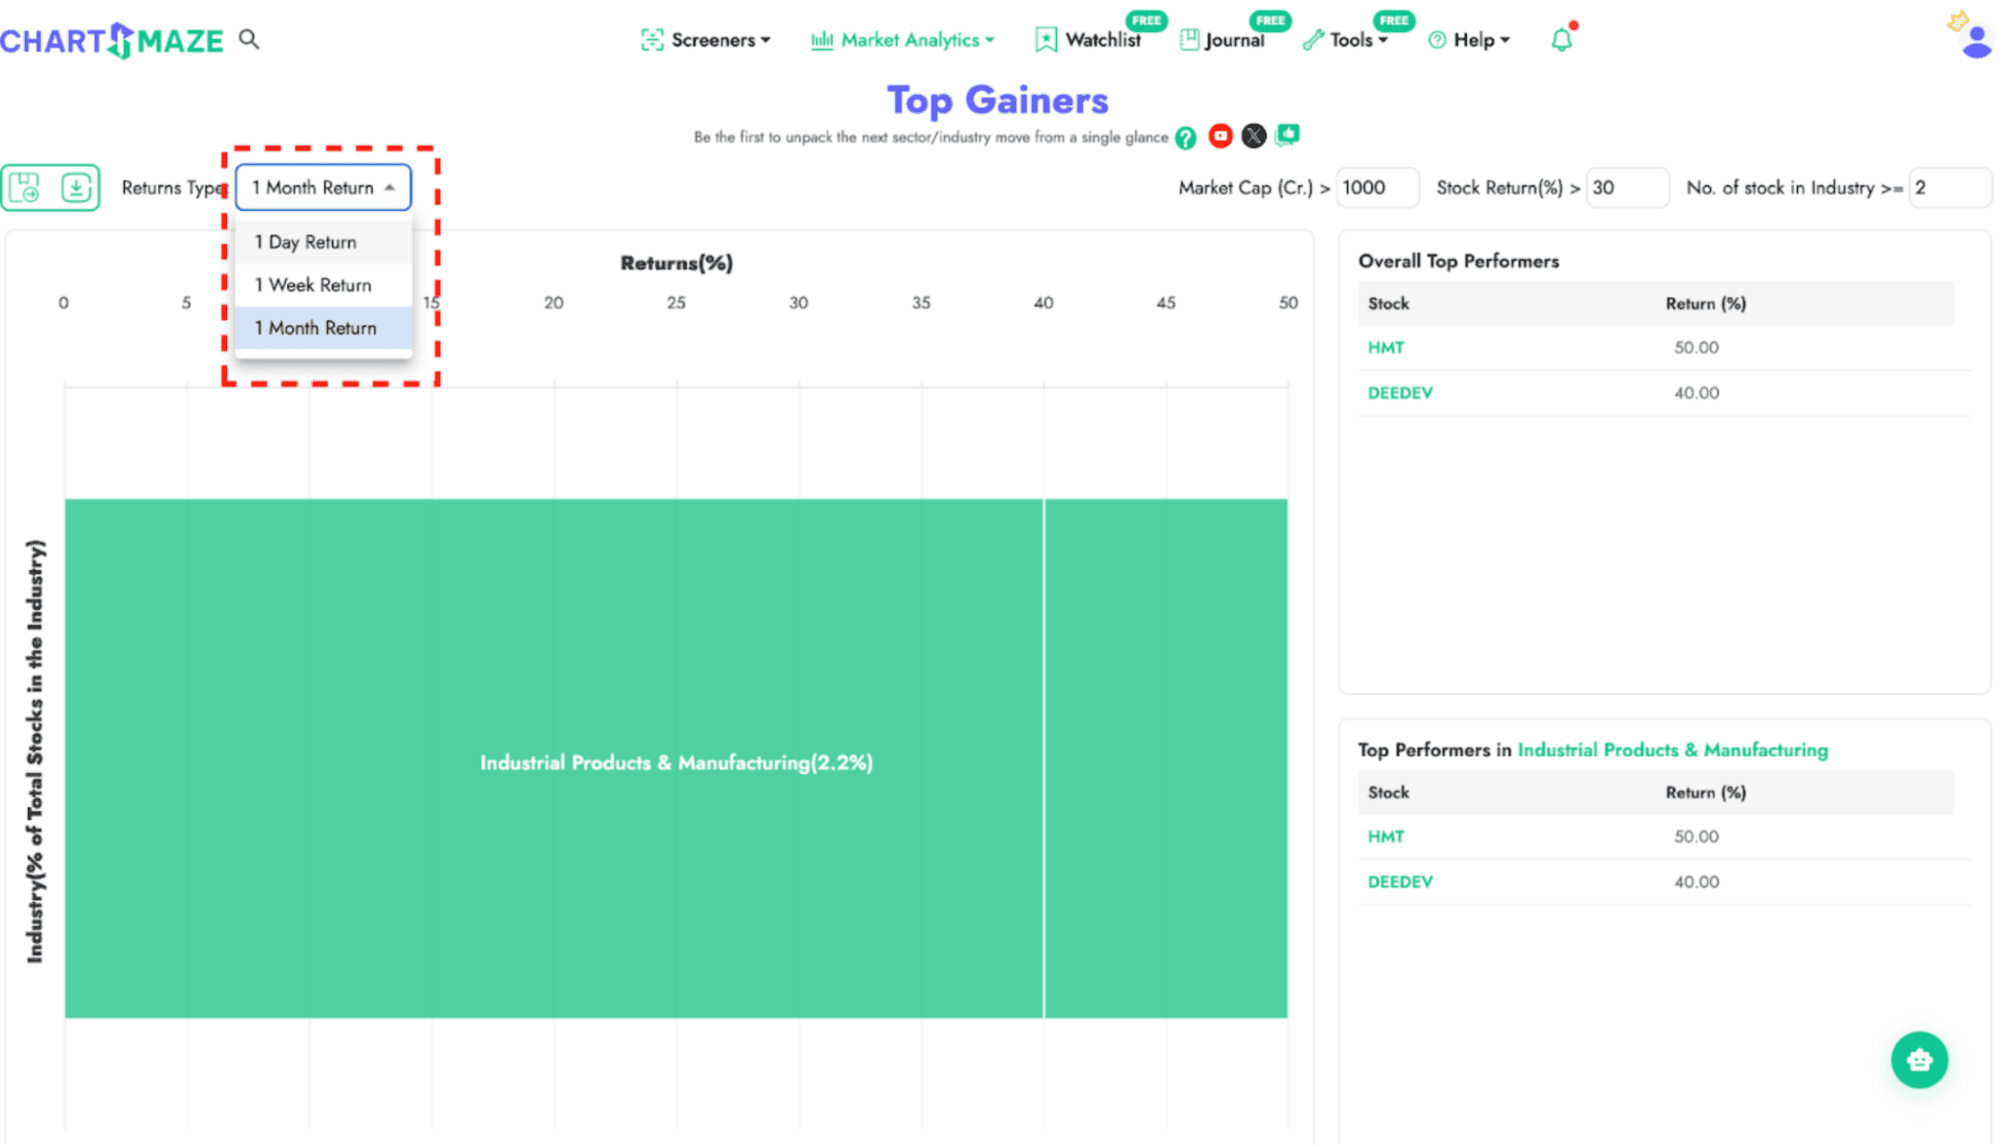
Sometimes you've to zoom out and see weekly or monthly gainers classified into industry groups. This solves two purposes:
1. It evens out noises at daily level.
2. If you've missed a group move because you didn't scan, you can still see the strength in weekly gainers.
2. If you've missed a group move because you didn't scan, you can still see the strength in weekly gainers.
Why you shouldn't expect Sector Rotation Daily
Before you consider you've found a secret tool for sector rotation, and start tracking sector rotation every day here's a quick note.
Don't EXPECT to see some industry/sector to dominate every day, else you will be disappointed or surprised.
If the dashboard is giving a signal, dive deeper, but don't expect a signal every day. Because Group move or sector rotation is not a daily phenomenon. It could be weekly or sometimes once a month or few months too.
How to Incorporate Top Gainers in Daily Scans
Before you run your scans, take 2 minutes to study the Top Gainers.
It instantly shows which industries are trying to pick momentum.
Then break it down to individual charts!
Especially if you're starting to scan after a long break, then it is a must to check daily gainers, and weekly gainers and then start your scanning workflow.
Why 'No Valid Data' Is Also a Signal
A common question we receive is whether 'No Valid Data' means there is a website error. It is not an error, it is a signal of broad market weakness.
This in itself is also a signal. If the market environment is brutal, then there is no way stocks or an industry will show group moves.
If you're consistently seeing no valid data on a daily basis, it's time to stay in cash and avoid trading.
How to Customize Top Gainer Filters
Let's take a step back and try to understand the definition of a Top gainer. We've given this flexibility for users to define the quality of stocks one wants to consider a top gainer
Market Cap Filter
For example people might not want to qualify < 1000 Cr as top gainers, you can choose Mcap filter.
Returns Filter
You can choose > 5% as top gainer or >10% as top gainer as per your convenience.
Threshold No of Stocks
Let's say your definition of domination is at least 5 stocks instead of 3 stocks, you can plug it as well.
The bars will change according to how you plug these values. If you don't want to customise, you can use our default values itself.
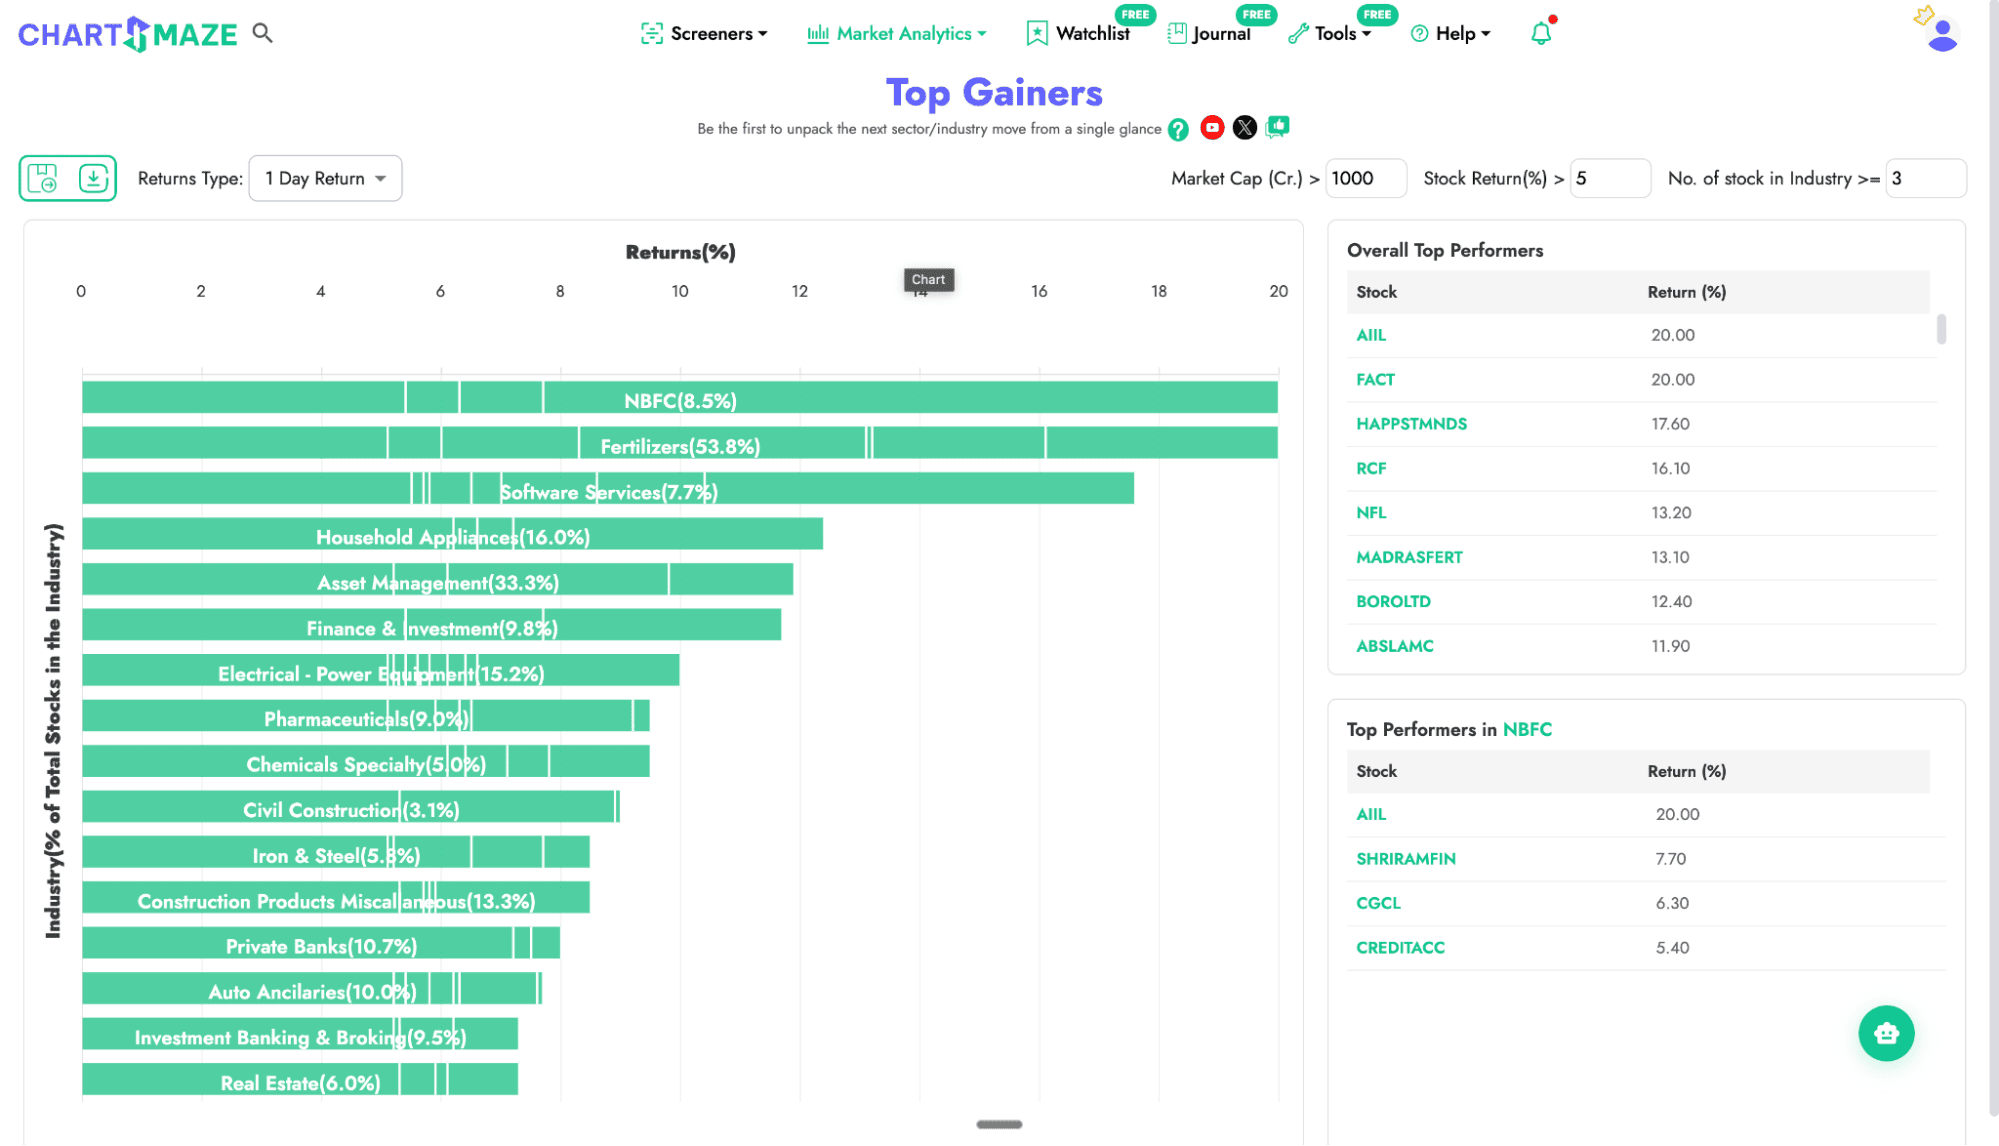
For example below is an example of when no of stocks per industry is changed from default value 3 to 5.
Conclusions
To get the most value from the Top Gainers list, analyze it at the industry level instead of only looking at individual stocks.
Follow these key practices:
- Monitor the Top Gainers list daily.
Make it a habit to review it every day, but remember that industry-wide theme moves do not appear every day. - Look at multiple time frames.
Checking weekly and monthly top gainers can help identify broader trends and sustained industry momentum. - Treat the absence of signals as information.
If very few stocks appear in the Top Gainers list, it may indicate overall market weakness or lack of participation. - Define your own criteria for strength.
Customize what you consider a strong industry move, such as the percentage of stocks from an industry appearing in the Top Gainers list.
Quick Answer
How can traders use Top Gainers to identify strong industries?
Traders can group Top Gainers by industry and measure how many stocks from each industry appear in the list. Industries with higher participation or percentage dominance often indicate sector strength, emerging themes, or early-stage momentum.