Trading works better when market is healthy, and works even better if the stock being traded is in a strong sector and industry. Although this is easy to comprehend, difficult to put it in practice. Because, clearly traders posed below challenges faced in achieving the above,
- Identifying leading sectors, industries in the overall market
- For any stock, check if it's in a strong sector, and compare it with similar stocks to see if it's a leader.
We tried to address the above issues with some number crunching as discussed below.
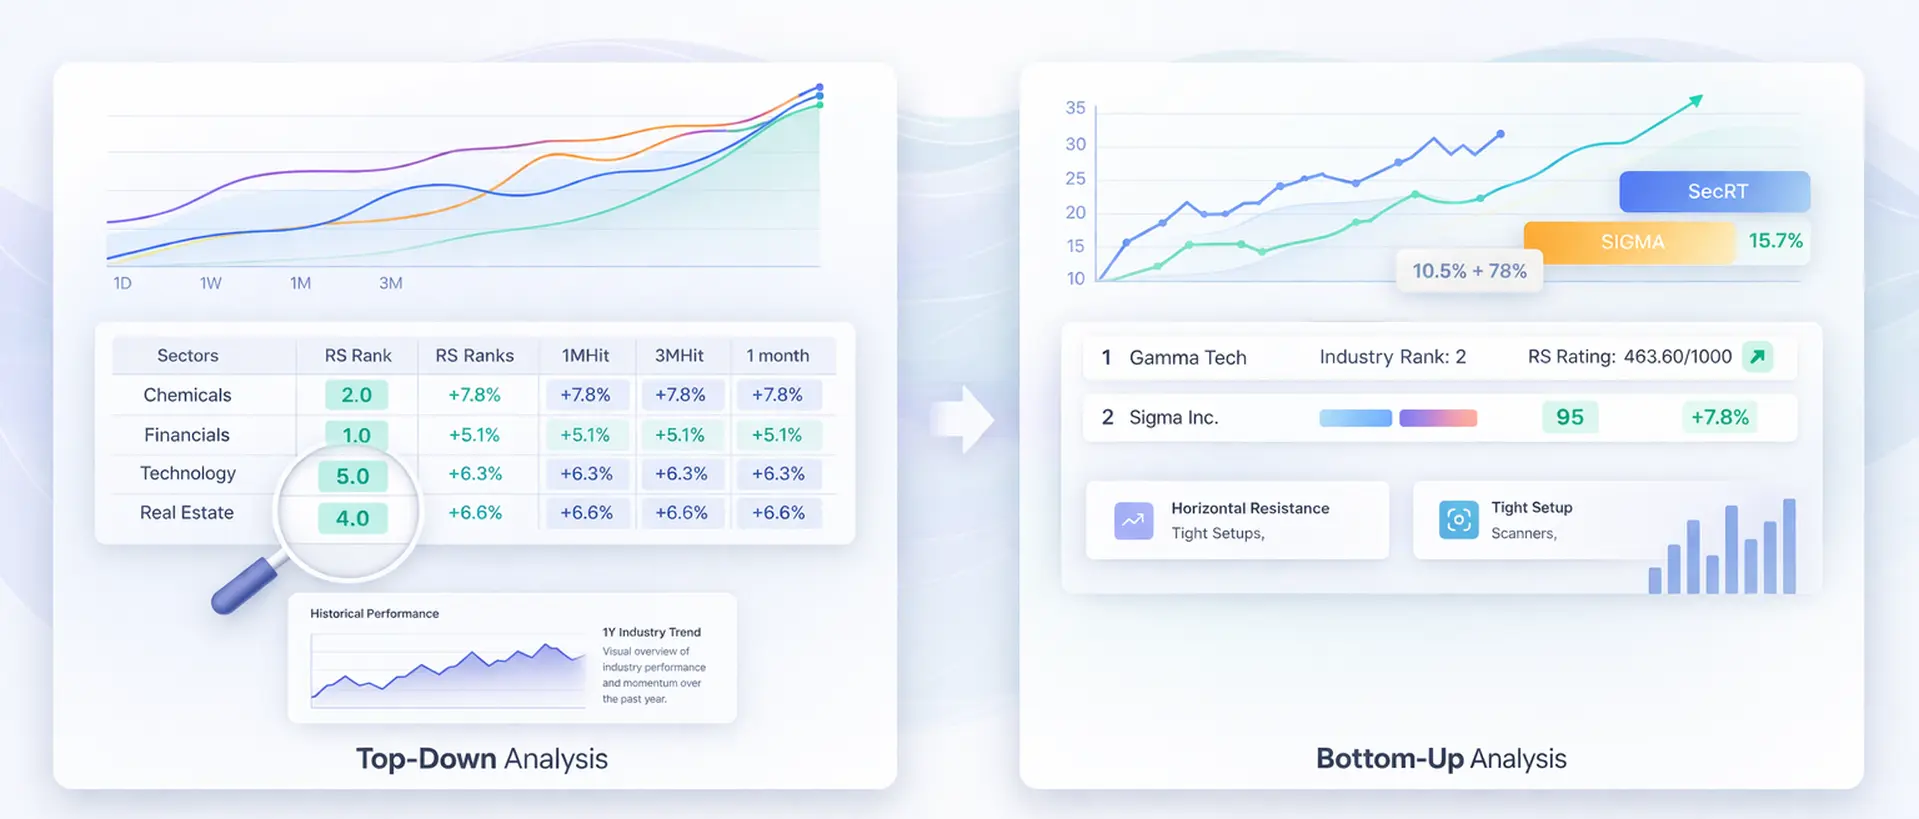
Top Down Approach :- Identifying leading industry followed by leading stocks
Top-down analysis begins by evaluating market sectors/industries, identifying strong groups, and exploring the stocks driving industry movements. Industry Analytics tab in Market Analytics sorts industries by performance across various time scales(1D, 1W, 1M, 3M) offering a broad view of sector and industry strength. Click on an industry to further check and sort individual stocks based on criteria like Relative Strength (RS) and 1-month returns.
If the industry rank is good across all time scales, one can conclude that the industry is trending.
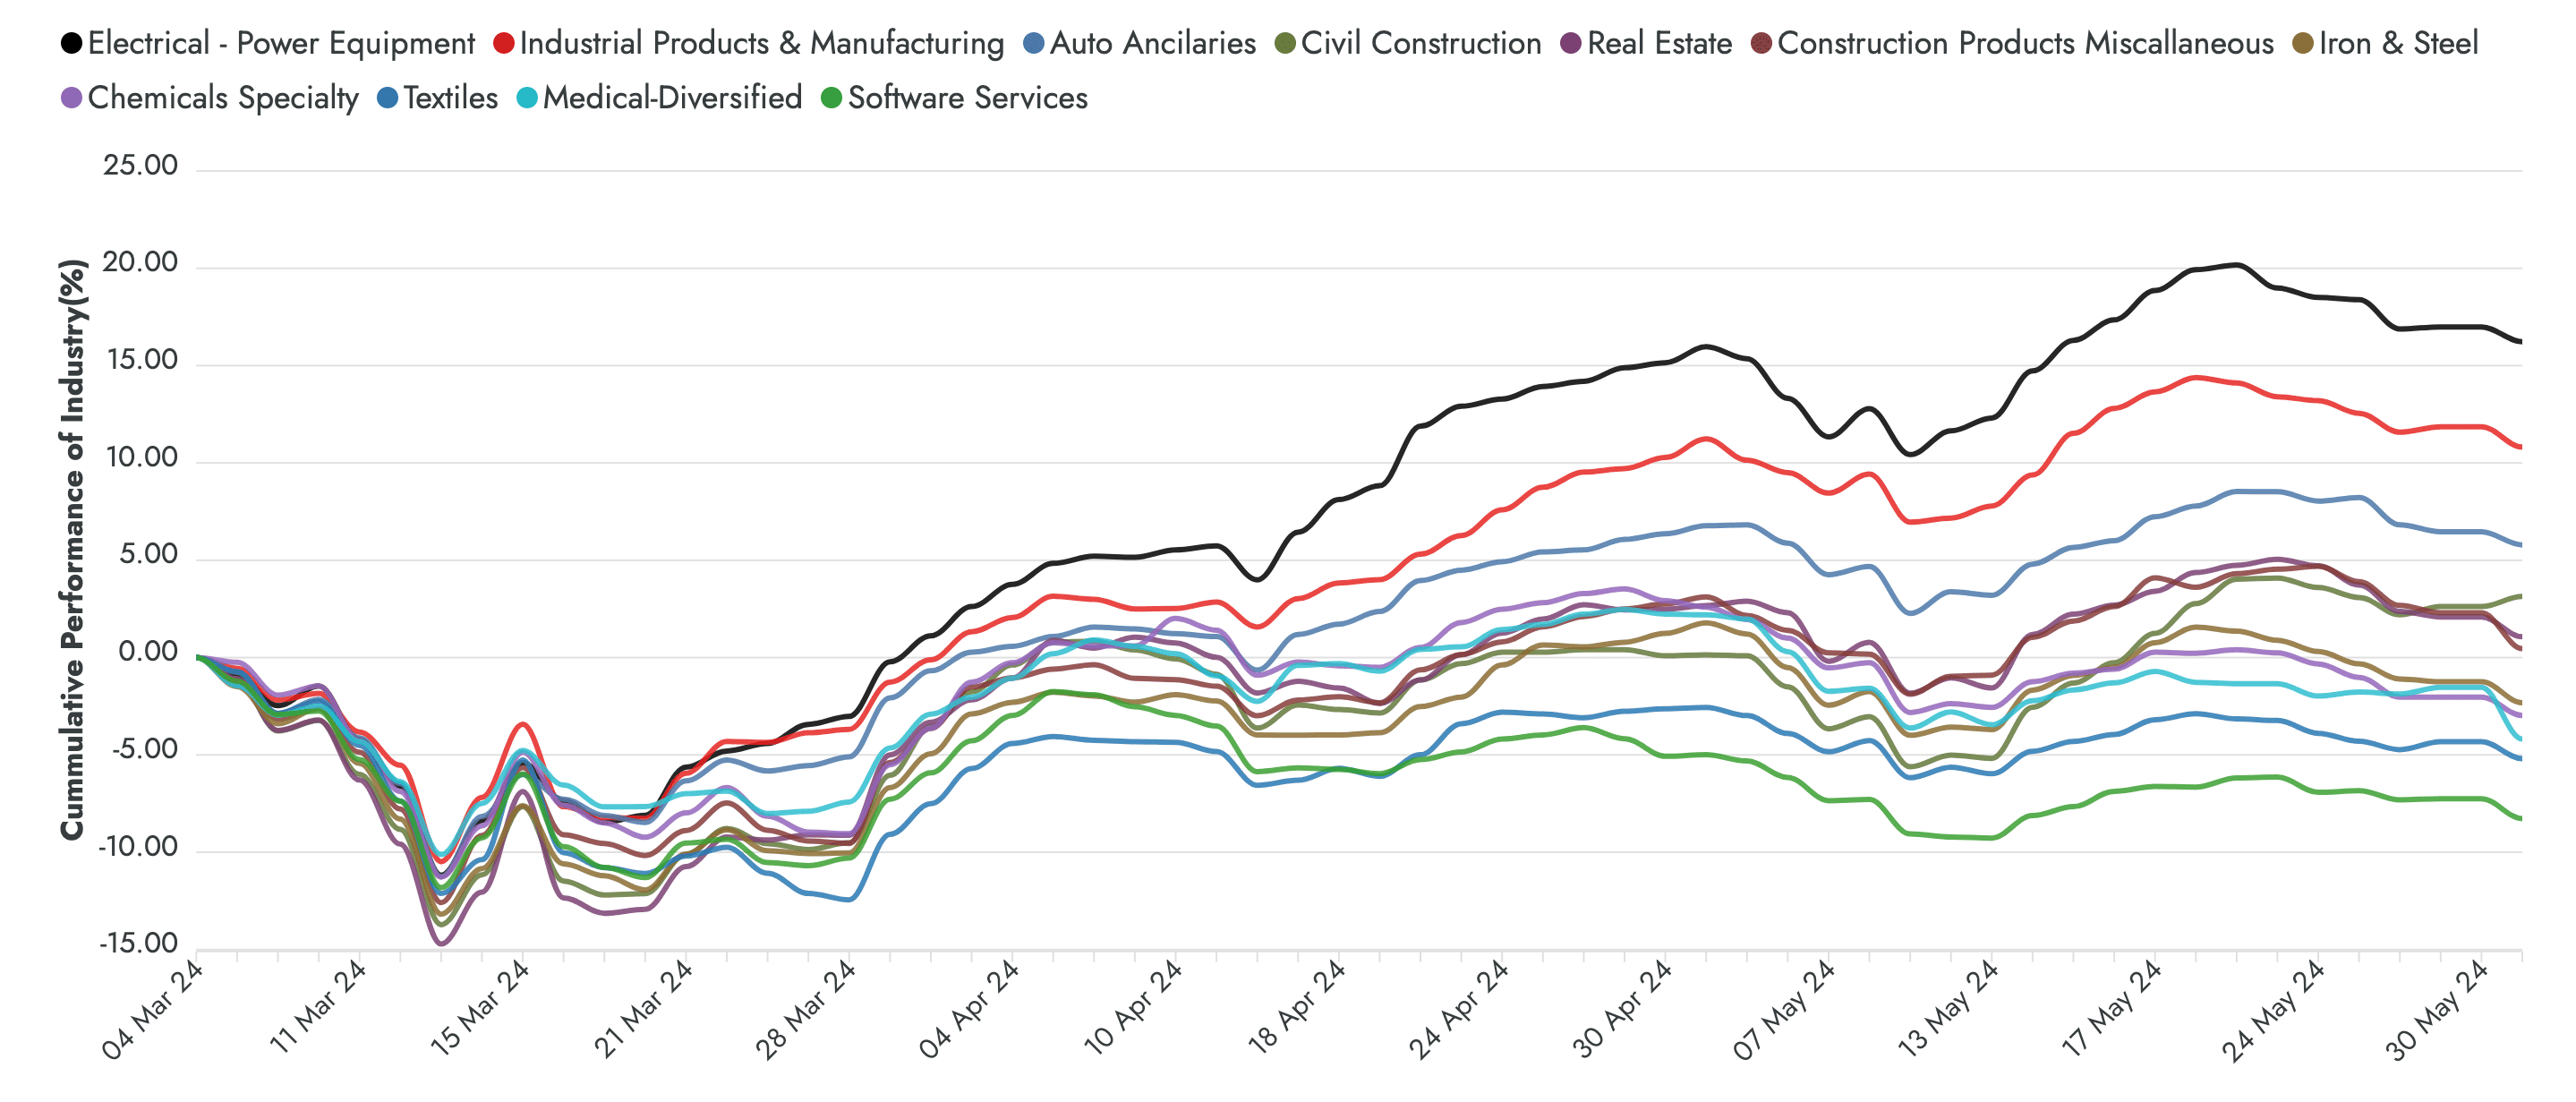
Historical Performance :-
This gives a pictorial overview of industry trends in past 1 year of industry groups.
Note: The tables and graph in the pages indicates the past performance of industry and isn't a measure of its future. While the time period for which an industry dominates in a market is dependent on so many other factors, it's better to do your own due diligence.
Bottom Up Approach :- For a stock, understand its sector strength, and compare with its peers
Prior to entering a trade, it's crucial to understand that the selected stock belongs to a robust industry, and further check other stocks in group to make sure you're hopping on to best stock in group. You can confirm this by studying its industry rank. This can be achieved at various sections of website as follows,
- Searching the stock in RS Scanner
- If you've identified the stock using the Horizontal Resistance and Tight Setup Scanner, promptly click on the industry column and proceed to the redirected page
Bonus :- Market breadth
The market breadth indicator reveals the count of stocks above their 20-day, 50-day, and 200-day moving averages. While many sources present this data in Excel format, we provide a visual representation for users, making it easier to comprehend at a glance.
